CodeAcross Atlanta: Revitalizing South Downtown
24 Feb 2015This past weekend, I attended my first hackathon-like event (there was no competitive element, so it's not a hackathon, technically speaking). Organized by Code For Atlanta and hosted by the Center for Civic Innovation as part of an international CodeAcross event, we met in South Downtown Atlanta to tackle the problems there, namely, how to revitalize the neighborhood.
In order to tackle the problem, we first had to understand the problem. So after a quick presentation on the history of the area, we took a walking tour of it. This introduction was captivating, but at the same time, I didn't see eye to eye with our hosts.
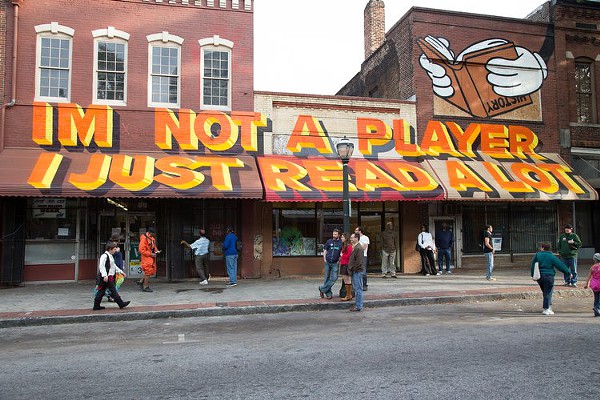
Many of the participants of this event were not from this area. They see it as a dilapidated poor neighborhood that needs to be cleaned up. But I live within 5 miles of South Downtown and enjoy biking through the area. I also regularly attend shows at the Eyedrum Art Gallery and Mammal Gallery. Yes, the neighborhood is poor, but people live and work here too. Often when we say we want to revitalize a neighborhood, it means gentrification. When we say we want to attract new developers, we're also implying that we want the old businesses out. That means Friedman's Shoes, who's been serving large feet since 1929. That means the local charm of Rondo, which sells hexes, charms, and mojo powder.
But I wasn't completely against the enterprise. I agree that many things could be improved in this area. But I tried to steer our group into thinking about what those needs were based on what the locals wanted instead of what tourists would want. To improve the area, we must improve the lives of the people in the area, not bring new people in.
Perhaps this is all too political for a tech blog, so let me go back to describing the rest of the weekend's events.
We broke into three groups:
- Branding and storytelling - how to brand the neighborhood to attract the 'right' elements
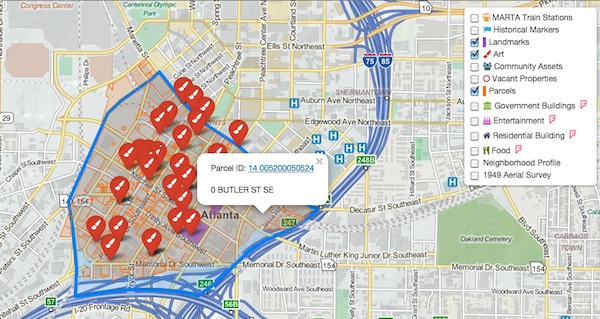
- Interactive asset map - so people can see what's there and what can be there
- Participatory tool - to gather opinions from the community about what the area needs
Mollie was the resident expert on maps and mapping. She showed us how to use Leaflet.js to quickly build out maps and create interactive event based behaviors. While she built out a prototype, the rest of us went through some tutorials to get acquainted with Leaflet, and also explore other possibilities like Mapbox.
After that, I started to think about where I could be most useful. Since Mollie was already kicking ass on the maps, I thought I could do something to help import the data. The data gathering team was sending us Excel files with street addresses. In order to plot the points, geocode data was needed, which just means latitude and longitude. So I decided to write a small utility that would take a CSV file and write a new CSV file with all the existing data plus latitude and longitude.
Writing a script to do that wouldn't have taken long, but I thought this might be a tool that could be used in the future by Code For Atlanta or other similar groups faced with this same problem. So I worked on a Ruby program that could potentially be re-used in other projects. You can see the code for it on GitHub, and I'll probably write a follow up post soon on a few interesting design challenges I ran into.
Day 2
Things began slowly with coffee at 9am. A few folks stared into their laptops like zombies. I was one of those. My CSV Geocoder was working, but I couldn't help tinkering with it, refactoring and improving it (in fact, I was still doing that earlier today). But more of the data was coming in in different formats. I was looking for a new task to do.
One of the things Mollie implemented the day before was integration of Foursquare data from their API. We were now pulling in data about government buildings in South Downtown. But what other Foursquare locations could we map? I wrote some scripts to automate this query. Other than that, I did some research on icons, and I also talked with members of the other teams about what they were doing.
At the end of the day, we all presented our projects. It was inspiring to see how much progress we made in just two days, and also to think about how all three projects will integrate into one larger project. The map will live on the website that the branding group created (which will eventually live at southdowntown.org) and the participatory tool created by the third team will eventually feed back into the map and website so that the wishes and desires of the locals will be our guide.
Speaking of the future, this weekend was just the beginning of a longer effort. We will continue to meet about once a month to continue developing this project.
Overall, I had a great first hackathon. I met some amazing people and learned a lot from them. I worked on interesting projects, and I got to become more familiar with a local neighborhood.
To learn more about the details of making the map, creating the layers and interactions, go read Mollie's excellent blog post about this same event! It's pretty great. You can also see the source of both the asset map and my CSV geocoder on the codeforatlanta GitHub page.